Unlock your website analytics
A GA4 website dashboard empowers IU website owners, marketers, and stakeholders to explore analytics pertaining to user behavior, traffic acquisition, audience demographics, and campaign performance.
A GA4 website dashboard empowers IU website owners, marketers, and stakeholders to explore analytics pertaining to user behavior, traffic acquisition, audience demographics, and campaign performance.
Take advantage of GA4 dashboard features to streamline reporting and draw insights from your website analytics.

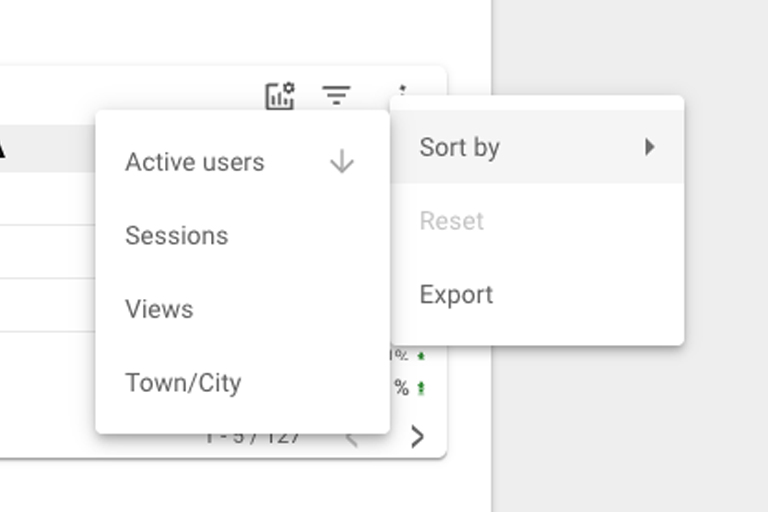
Filter your dashboard by date range or sort individual visualizations by a key metric using the Sort by options.

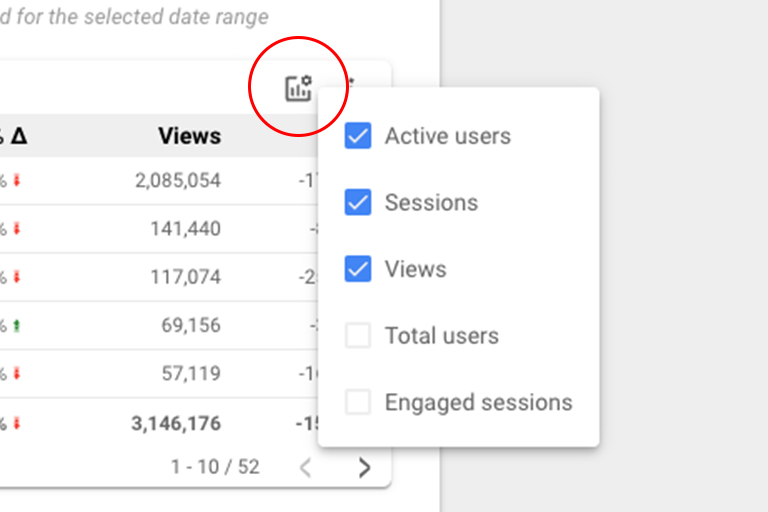
Choose the best metrics for your reporting needs with the Optimal Metrics menu to compare side by side or simplify your view.

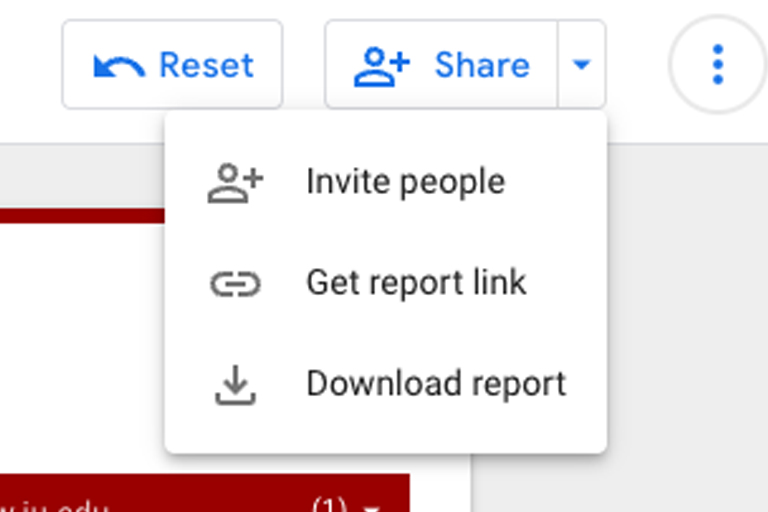
Download your dashboard report as a PDF or export the data from a single visualization to a sheets document for a deeper dive.

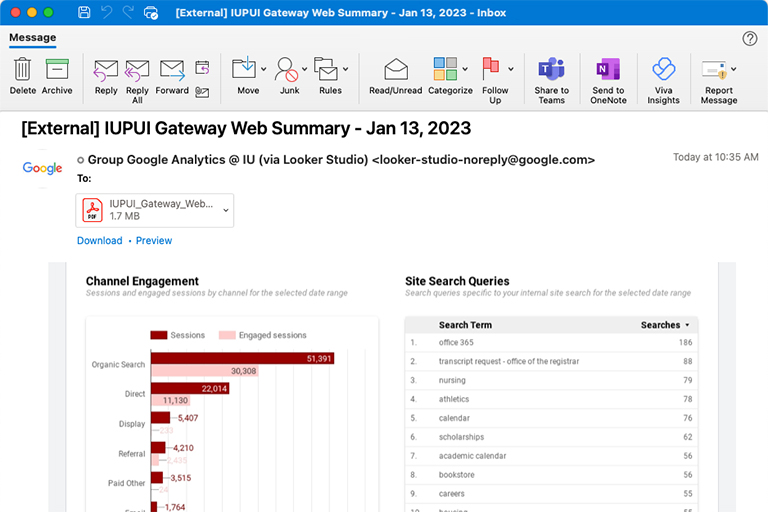
Request dashboard access and automated monthly email reports for your stakeholders.
As you begin to use your Google Analytics 4 (GA4) dashboard, you may start to compare metrics against old Universal Analytics (UA) reports. Because the GA4 model is based on events and the UA model was based on sessions, you'll notice a difference in metrics.
Email us at manahelp@iu.edu.